

This article will show you how to create an inner line chart Excel.
| Join the channel Telegram of the AnonyViet 👉 Link 👈 |
Line graph
This article will guide you to create a line chart in excel
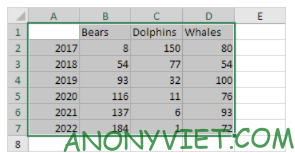
1. Select range A1:D7
2 On the Instert panel select line symol

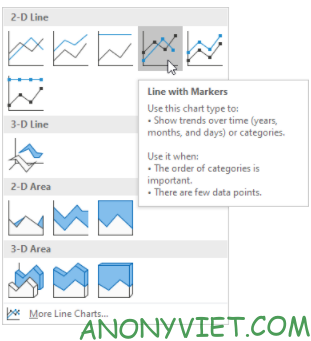
3. Select Line with Markers
Result

To customize this line chart do the following
4. Select line chart
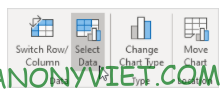
5. In Desgin Tab , select Data
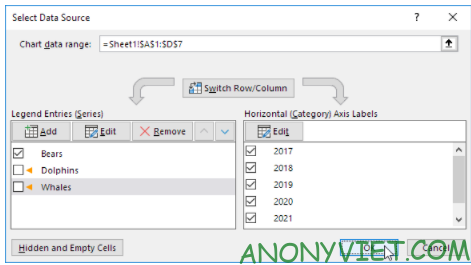
6. Deselect Whales and Dolphins
Result

In addition, you can also view many other excel articles here.