This article will show you how to create a thermometer chart in Excel.
| Join the channel Telegram of the AnonyViet 👉 Link 👈 |
Thermometer chart
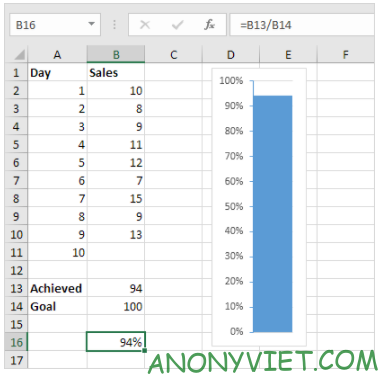
To create a thermometer chart, do the following:
1. Select cell B16.
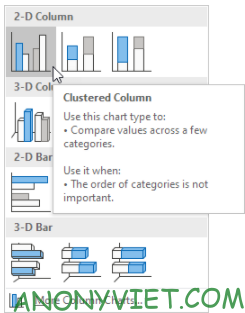
2. On the Insert tab, click the Columns icon.

3. Click on Clustered Column.

Result

4. Delete the chart cell and the horizontal axis.
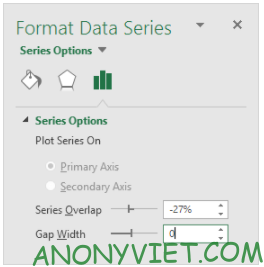
5. Right click on the blue bar, click Format Data Series and change the Gap Width to 0%.

6. Change the width of the chart.
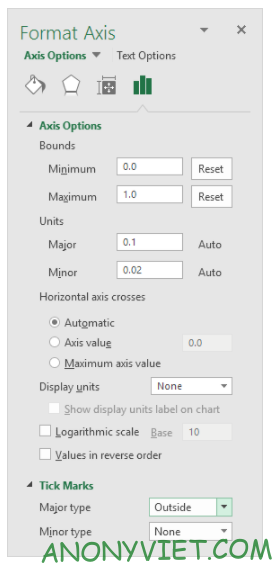
7. Right click on the percentage on the chart, click Format Axis, change the minimum bound to 0, maximum bound to 1 and set the Major tick type to Outside.

Result

In addition, you can also view many other excel articles here.


