In the process of doing bachelor’s thesis, master’s thesis, doctoral thesis by quantitative method, you will certainly come across a concept that is: Std Deviation in SPSS.
| Join the channel Telegram of the AnonyViet 👉 Link 👈 |
So what is Std Deviation? What is Std Deviation in SPSS? how to calculate it? We invite you to learn from the Community Knowledge through the article below.
1. Answer questions about Std Deviation

-
- What is Std Deviation? This is actually Acronyms by Standard Deviation – Translated into Vietnamese means Standard deviation (Also known as a measure of variation).
- According to Encyclopedia Wikipediathe concept of Std Deviation – standard deviation is the word for only one statistical quantity, is used to measure the dispersion of a data set. Here, the data file has been tabulated.
- Std Deviation reflects
-
- If result standard deviation short which means the values tend to be close to the data file mean.
- If the standard deviation High which means that the values in the data file are being spread out over a wider range.
- In the SPSS data analysis software, the standard deviation represents degree of dispersion/difference of the data relative to the mean. However, there is no such thing as an “acceptable” level of data. Whether the standard deviation is good or bad will depend on the expectations of the person doing the research.
For data analysis in SPSS, understanding the meaning of Std Deviation is also a prerequisite so that you can later run other tests, such as running analysis. pearson correlation coefficient in SPSS. Understanding the nature of Std Deviation will help you deploy and implement more quickly and easily.
2. Meaning of Std Deviation in SPSS
After understanding the concept of what is Std Deviation and what is Std Deviation in SPSS, we will learn about more in depth about meaning of standard deviation in SPSS.
2.1. Measure volatility

- In the process of conducting the study and then conducting the analysis in SPSS software, the standard deviation will help measure the amount of volatilityalso known as the difference between the candidate’s answers.
- If the standard deviation short does that mean movement between the answers is trivial and vice versa..
- Through this distinction, the person conducting the research can assess trends of the participants who answered Is it even?from which the necessary conclusions can be drawn.
2.2. Calculating the possibility of risk

- The standard deviation is an effective parameter to calculate the possibility of riskespecially for those who work in the financial sector and in jobs such as analysts, portfolio managers, financial advisors.
- Standard deviation big would normally show high level of risk more in investment.
- During the research, this is basis for investors to consider and Give decision whether they are willing to take the risk or are still risk averse.
3. Example of Standard Deviation in SPSS
Let’s take a look at an example of how to measure standard deviation in SPSS on a data file. In detail, to calculate the standard deviation of the above data file, it is necessary to perform the following steps:
- Step 1: Descriptive statistical analysis of mean in SPSS: access Analyze => Descriptive Statistics => Descriptives.
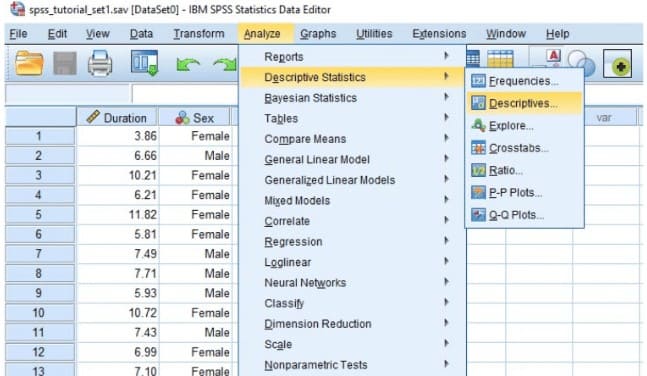 Go to Analyze => Descriptive Statistics => Descriptives
- Step 2: A new dialog box will open with two columns, drag the variables to run descriptive statistics from the left column to the item Variable(s) on the right.
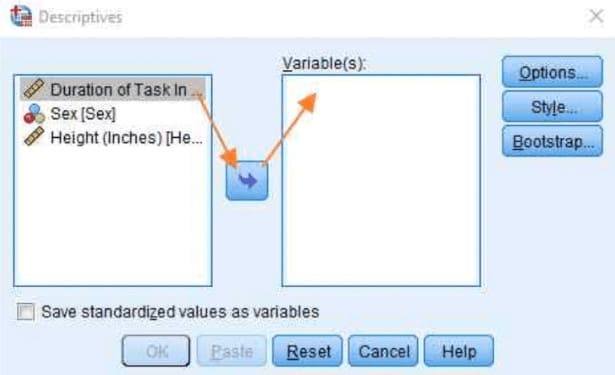
- Step 3: Click select Options, Selective Mean and Standard Deviation.
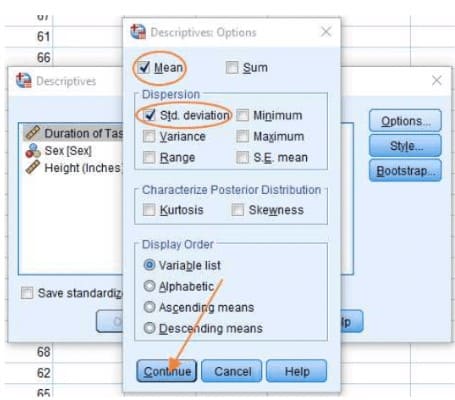
- Step 4: Click select tiếp tục Go back to the main dialog and press OK.
- Step 5: The results will be displayed on the SPSS Output screen. Users read results and research.
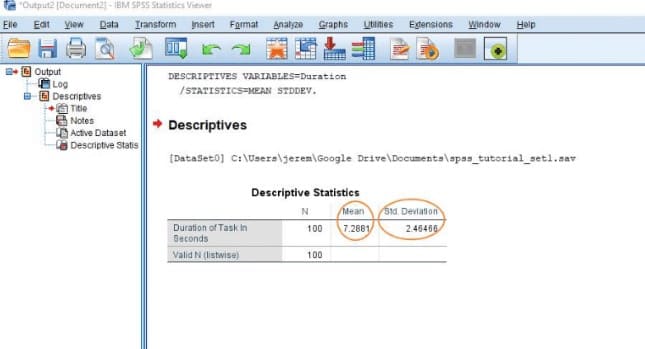
- As the results show in the table above, it can be seen that the standard deviation of this data file is Std. Deviation = 2.46466.
- After obtaining the results of the standard deviation in SPSS as above, we can calculate the CV (Coefficient of Variation) – coefficient of oscillation. This coefficient is calculated using the following formula:
- CV= SD/Mean
- The results of the standard deviation and the coefficient of variation will now help the user to read the amplitude of the fluctuation of the data. Specifically:
- CV>1: A standard deviation larger than the mean indicates that the data fluctuates very strongly. In this case, the collected numbers have a large difference.
- CV<1: A standard deviation smaller than the mean indicates weakly fluctuating data. In this case, the numbers collected have a small difference.
- Comparing with the example above, we can calculate the Oscillation Coefficient as follows:
- CV = SD/Mean = 2.46466/7.2881 = 0.33818
- As can be seen, CV < 1 shows that the standard deviation is smaller than the mean, the data fluctuates weakly.
In fact, the above example is just basic calculation of standard deviation in SPSS. To be able to use this software proficiently, it requires users to have in-depth specialized knowledge and skills in the field of data analysis.
To process data on a large scale, more complex methods are needed, in this article we would like to introduce to you. data processing service professional support to calculate and process data in SPSS in a short time.
Here’s everything you need to know about What is Std Deviation? and the meaning of st deviation in SPSS. Hopefully, through this article, readers will get useful information for the implementation of their research projects! Please also continue to follow Community Knowledge for continuous updates of useful information!


