I have completed the first course in the Google Data Analyst Certification (Google Data Analytics Professional Certificate). So in this post, I’ll share what I’ve learned from the course Foundations: Data, Data, Everywhere for you guys.
Information about the course
This is the first course in the Google Data Analytics Certification. These courses will equip you with the skills you need to apply for entry-level data analysis jobs. Organizations of all types need data analysts to help them improve processes, identify opportunities and trends, launch new products, and make decisions. In this course, you’ll be introduced to the world of data analytics through a hands-on curriculum developed by Google. The course covers a wide range of data analytics topics and is designed to give you an overview of what’s included in the Google Data Analytics Certification. Current Google data analysts will teach you best practices to accomplish common data analysis tasks using the best tools and resources.
Learners who complete this certificate program will be equipped with the knowledge and skills to apply for entry-level jobs as data analysts. No previous experience.
By the end of this course, you will:
- Gain an understanding of the methods and processes used by a data analyst in their day-to-day work.
- Learn about key analytical skills (data cleaning, data analysis, data visualization) and tools (spreadsheets, SQL, R language, Tableau).
- Explore a variety of terms and concepts related to the data analyst role, such as the data lifecycle and data analytics workflow.
- Evaluate the role of analytics in the data ecosystem.
- Self-assessment of analytical thinking.
- Explore job opportunities available to you upon completion of the program and learn about job search best practices.
How to get the course
To receive this course, you can buy directly from the coursera website. Or apply for the government’s digital talent development (NIC) scholarship program here.
With the patronage of the National Innovation Center, Google is committed to Free funding of course account with term of 12 months, worth 168 USD/account for employees working in state agencies, organizations, enterprises, freelance workers; Officials, lecturers and final year students from universities and colleges across the country participated in online learning a number of courses designed and trained by a team of prestigious Google experts on the Coursera system. Flexible study time according to the individual schedule of each student.
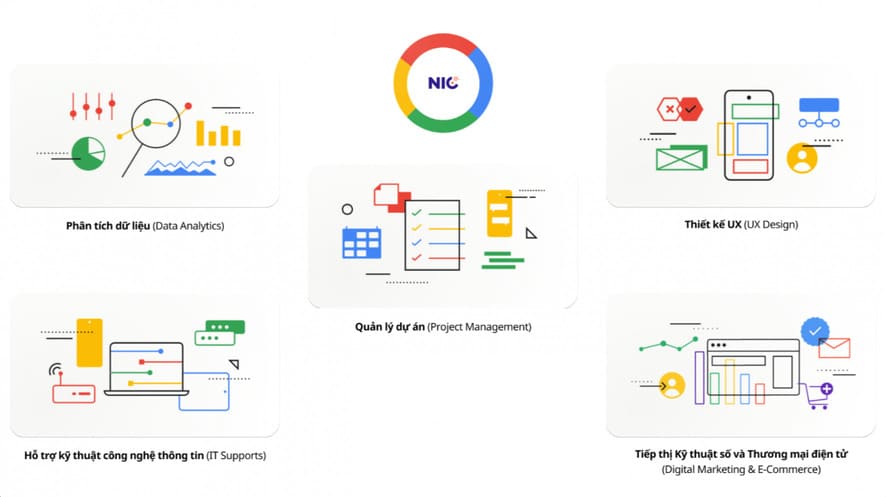
When being considered for a scholarship, Students will be provided with an account by Google with The Program’s 5 courses include: Data Analysis (Data Analytics)Information technology technical support (IT Supports)Project management (Project Management)UX Design (UX Design) and Digital Marketing and E-Commerce (Digital Marketing & E-Commerce). Completing each course on the system, Students will be provided Professional certification by Google (Google Career Certificate).
What I learned from the Google Data Analytics Professional course
First week
In the first week, I learned about Data, Data Science, Data Analyst, Data Analysis, Data Analytics and Data Analytics Process. I learned that Data is a collection of facts or information that, through a data set, a data expert known as a data analyst, can draw conclusions and make decisions. make predictions as well as data analysis decisions. Data-driven decisions (data-driven) is a strategic concept to promote business operations correctly. It is defined as using information to decide on business strategy.
There are six stages of the data analysis process: Ask, prepare, process, analyze, share, act.
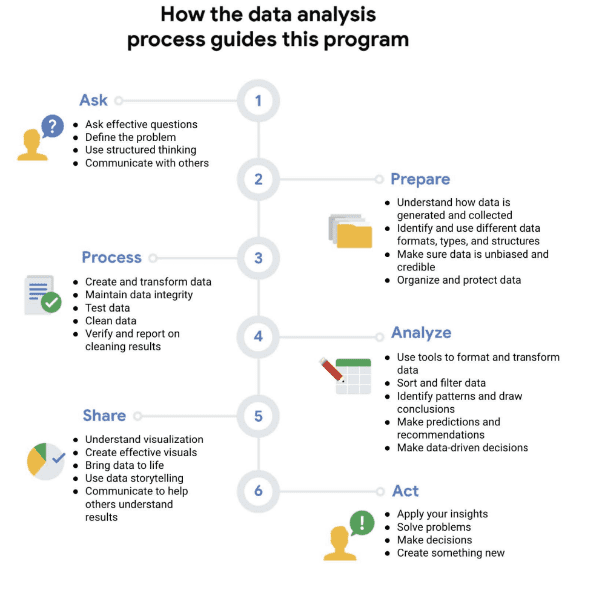
Ask: A data analyst will try to understand the type of project and what the outcome of the project will be by asking effective questions. To identify these, they asked people who could help them with the problem, such as leaders or managers.
Prepare: After completing the above step, the analyst needs planning data. They need to define a timeline for this project and start gathering data based on the question posed. The most important fact in this phase is timing and data collection.
Handling: After collecting the data, we need to check the data, is there any missing information. We need to manage and store data securely. The data cleaning process is the most important task in this phase.
Analysis: This is the main task of the data analyst. They need to demonstrate experience, knowledge, and creativity. And analyze all the facts to find all the answers to the question posed.
Share: During this phase, the analyst shares their results with stakeholders and chats with project team members.
Act: In the final stage, the data analyst and other team members will try to implement data-driven decisions for the company.
Furthermore, an ecosystem (ecosystem) is a group of elements that interact with each other. Similarly, the data ecosystem (data archive) is a group of elements that interact with each other to produce, manage, store, organize, analyze, and share data.
General lifecycle of data analytics:
- Ask: Accept business challenges, find goals and questions.
- Prepare: Data generation, collection, storage and management.
- Handling: Clean data/ensure data integrity.
- Analysis: Explore, visualize, and analyze data.
- Share: Communicate and interpret results.
- Act: Use decisions from analysis to solve problems.
2nd week
In the second week, I learned about Data Analysis Skills, Analytical Skills, Data Based Decisions.
Analytical skills are the qualities and characteristics associated with problem solving using data. There are 5 essential skills of a Data Analyst: Curiosity, Understanding Context, Having a Technical Mindset, Data Design, Data Strategy.
Analytical thinking involves identifying a problem, then solving it using data in an organized, step-by-step manner. There are five main things to build analytical thinking: Visualization, Strategy, Problem Orientation, Correlation, Big Thinking, and Detail Orientation.
Visualization are some graphical representations of information, which help us to understand the data. Strategy means what solution they want to achieve and how they can achieve it. Data Analysts use Problem Oriented thinking to identify, describe, and solve problems. Correlation is like the relationship between data, holistic thinking means seeing everything in one picture. Detail-oriented thinking is figuring out everything to execute the plan. Using data, we can deepen our understanding, verify theory, better understand business location, support and business planning. Data-driven decisions can improve any business in many ways.
Week 3
In the third week, I learned the data life cycle, the data analytics workflow, and the data analysis tools.
The data lifecycle consists of six steps: Plan, Collect, Manage, Analyze, Store, and Discard. Of those stages, planning is the most important. Because we need to understand what kind of data we need to collect, how we can manage it throughout the lifecycle, who will be responsible for that data, and optimize the results.
The next stage is collection, where we need to collect data from sources. Another important stage is management, in this phase we need to properly store data and make sure it’s safe. Next is Analysis, without analyzing we cannot draw conclusions. In this phase, we need to solve the problem. Archiving means storing data in a place where it is still available but not reused. Finally, we need to destroy the data to protect it.
Then we will discuss the data analysis process. In data analysis, spreadsheets, query languages, and visualizations are most commonly used. There are many spreadsheets. But two popular options are Microsoft spreadsheets and Google Spreadsheets.
A query language is a computer programming language that allows you to retrieve or manipulate data from a database. The most common query language is SQL. A database is a collection of data stores in a computer system.
And, I used visualization technique, which helps me understand the data set easily. A visualization is a graphical representation of data. Graphs, maps, and tables are examples of visualizations. The most popular visualization tools are Tableau and Looker.
Week 4
In the fourth week, the course will give a fairly simple introduction to spreadsheets and SQL. On October 17, 2019, Google celebrated the 40th anniversary of computer spreadsheets. The first name of the calculator spreadsheet was VisiCalc. A worksheet consists of a large number of cells and all cells are identified by columns and rows.
In datasets, column labels are often referred to as attributes. An attribute is a characteristic or quality of data. On the other hand, rows are called observations. An observation includes all the attributes for something contained in a row of a data table.
We have many ways to work on spreadsheets including functions and formulas. Furthermore, SQL can perform many of the same operations with data. You can use SQL to store, sort, and analyze data. Finally, they introduced Qwiklabs.
Week 5
In week five, Google talks about why we should learn Google Data Analytics Professional skills. There are many companies that need business analysis including technology, marketing, finance, healthcare, etc. to improve their business.
That’s why they need a data analyst. Additionally, they talk about the importance of fair business decisions, where they discuss corporate issues. An issue is a subject and object for investigation. A question is designed to uncover information and the problem is an obstacle to be solved.
Next, Google discusses how we can find our dream job. To do this, we need to focus on a few common factors: what industry do you like to work in, what tools are needed for you, the right place to work, transportation and company culture. . All of the above factors mean a lot to a data analyst.
There are many positions for a data analyst:
- Business Analyst: Analyze data to improve business processes, products or services.
- Business Intelligence Analyst: analysis of financial or market data.
- Data analytics consultant: analyze the system or model to use the data.
- Data Engineer: prepare and integrate data from different sources for analysis.
- Data Scientist: use technical and social science expertise to find trends through data analysis.
- Data expert: organize or transform data for use in a database or software system.
- Operations Analyst: Analyze data to improve the performance of business operations and workflows.
Finally, there is the final certification exam. I have been granted a certificate and am about to take the 2nd course out of 8 courses of this certificate. I will continue to share what I have learned after completing this certificate. So make sure you watch it.
In addition, you can also refer to other free courses on Anonyviet here.


