This article will show you how to use descriptive statistics in Excel.
| Join the channel Telegram of the AnonyViet 👉 Link 👈 |
Descriptive statistics
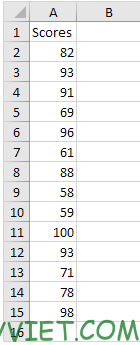
You can use Excel’s Analysis Toolpak utility to generate descriptive statistics. For example, you have the scores of 14 participants for a test.

1. On the Data tab, select Data Analysis

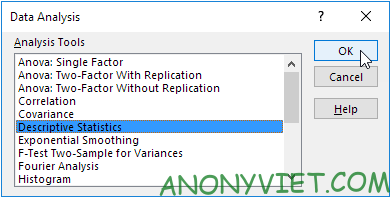
2. Select Descriptive Statistics and click OK.

3. Select the range A2:A15 as the Input Range.
4. Select cell C1 as Output Range.
5. Make sure Summary statistics is ticked

6. Press OK
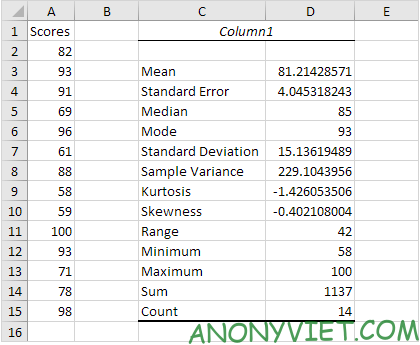
Result

In addition, you can also view many other excel articles here.


