This article will guide you to create a data table for your work in Excel.
| Join the channel Telegram of the AnonyViet 👉 Link 👈 |
Data sheet
Instead of creating different scenarios, you can create data tables to quickly try different values for formulas. You can create a single-variable data table or a two-variable data table.
Let’s assume that you own a bookstore and have 100 books in stock. You sell a certain % of books for a top price of $50 and a certain % for a lower price of $20. If you sell 60% at the highest price, cell D10 below will calculate a total profit of $60 * $50 + $40 * $20 = $3800.
One-variable data table
1. Select cell B12 and enter =D10 .
2. Enter different percentages in column A.
3. Select the range A12:B17.
We will calculate the total profit if you sell 60% for the top price, 70% for the top price, etc.
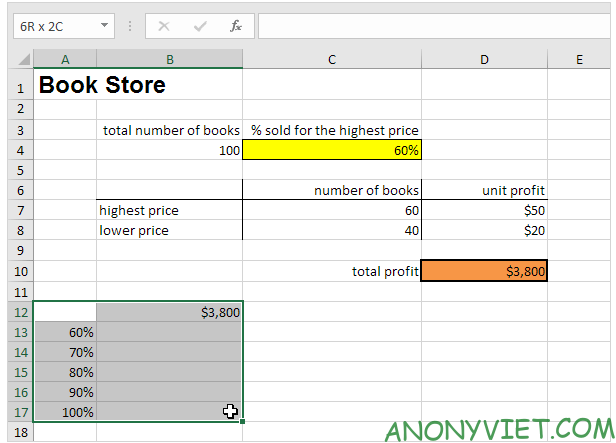
4. On the Data Tab click What-If Analysis.

5. Click on Data Table.

6. Click the ‘Column input cell’ box and select cell C4.
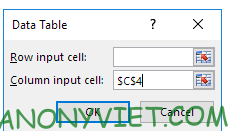
7. Click OK.
Result
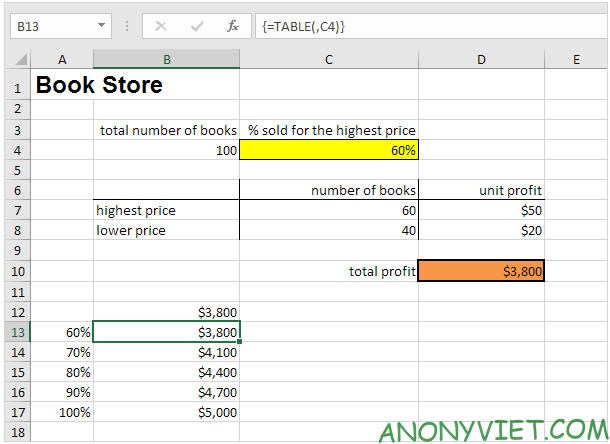
Conclusion: if you sell 60% at the highest price, you make a total profit of $3800, if you sell 70% at the highest price, you make a total profit of $4100, etc.
Two-variable data table
1. Select cell A12 and enter =D10.
2. Enter different returns (highest price) in row 12.
3. Enter different percentages in column A.
4. Select the range A12:D17.
We will calculate the total profit.
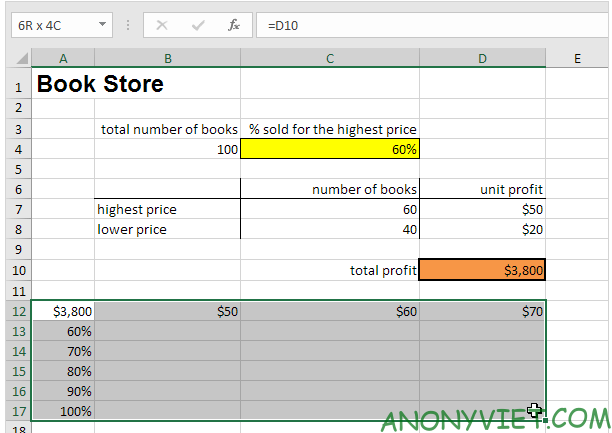
5. On the Data Tab click What-If Analysis.

6. Click on Data Table.

7. Click the ‘Row input cell’ box and select cell D7.
8. Click the ‘Column input cell’ box and select cell C4.
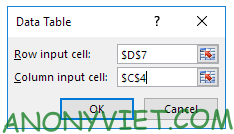
9. Press OK
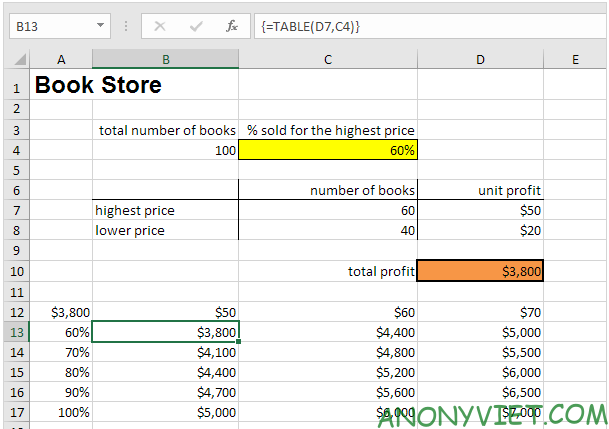
Conclusion: if you sell 60% at the highest price, with a unit profit of $50, you make a total profit of $3800, if you sell 80% at the highest price, with a unit profit of $60 , you get a total profit of $5200, etc.
In addition, you can also view many other excel articles here.


