This article will show you how to create an association chart in Excel.
| Join the channel Telegram of the AnonyViet 👉 Link 👈 |
Combination chart
In this tutorial I will show you how to create a combo chart.
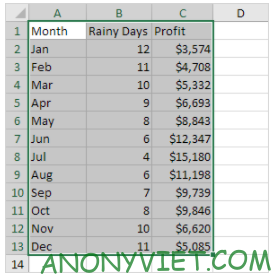
1. Select the range A1:C13.
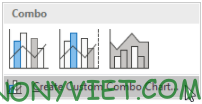
2. On the Insert tab, click the Combo icon.

3. Click Create Custom Combo Chart.
4. For the Rainy Day series, select Clustered Column as the chart type.
5. For the Profit series, select Line as the chart type.
6. Plot the Profit series on the second axis.
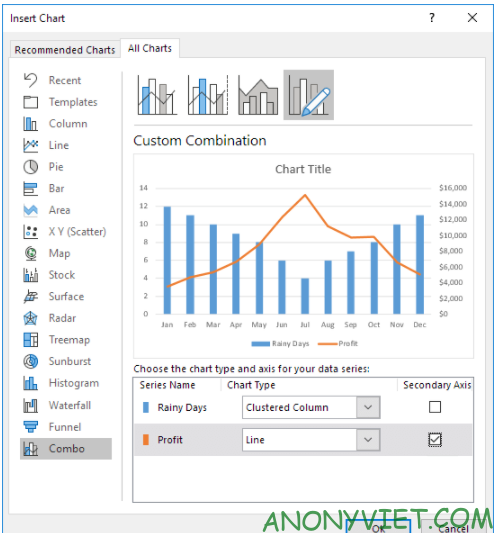
7. Press OK
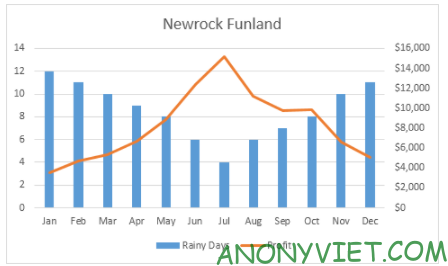
Result
In addition, you can also view many other excel articles here.

