This article will show you how to create a scatter plot in Excel.
| Join the channel Telegram of the AnonyViet 👉 Link 👈 |
Scatter chart
This article shows you how to create a scatter chart in Excel
Only markers
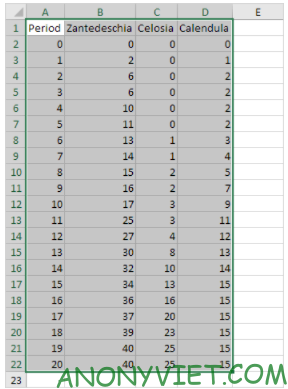
1. Select the range A1:B10.

2. On the Insert tab, click the Scatter icon.

3. Click on Scatter

Result:

Follow the Straight Line
1. Select the range A1:D22.

2. On the Insert tab, click the Scatter icon.

3. Click on Scatter with Straight Lines

Result

In addition, you can also view many other excel articles here.


