Netdata is a free system analysis and performance monitoring service. Netdata is designed to provide users with real-time insights into server, application, and service performance, helping you quickly detect, resolve issues, and optimize Server.
| Join the channel Telegram belong to AnonyViet ???? Link ???? |
Netdata Cloud highlights:
- Real-time monitoring: Netdata provides data on system performance with the lowest latency, helping users to grasp system health in real time.
- Data visualization: Netdata uses intuitive and easy-to-understand graphs to present information about system performance, making it easy for users to analyze data.
- Alerts and Notifications: Netdata supports alerts based on CPU, RAM, Network thresholds and abnormal behavior, helping users quickly detect potential problems in the system.
- Integration with other tools: Netdata supports sending notifications when the Server has problems by ways such as email, discord, telegram…
- Manage multiple systems: Netdata Cloud allows users to monitor and manage multiple server systems and applications from a single interface, making it easy for them to manage complex environments.
- Flexible programming languages: Netdata is written in C, Python, and Go, supports many other programming languages, allowing users to customize and extend easily.
- Strong Community: Netdata is an open source project with a large community of developers and users, providing constant support and updates.
How to install Netdata to monitor Server performance
To install Netdata Server performance monitoring, you need to first register an account at Netdata. After logging in, choose Connect Node.
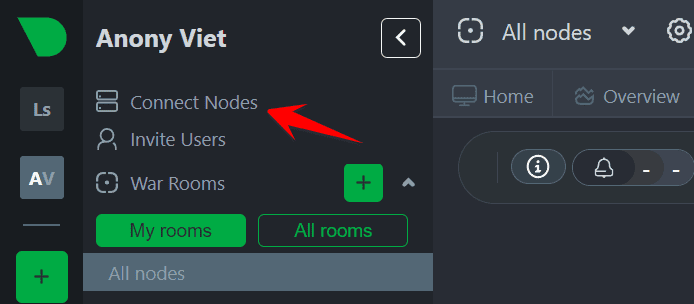
You can install Netdata on your server using wget, curl or docker…
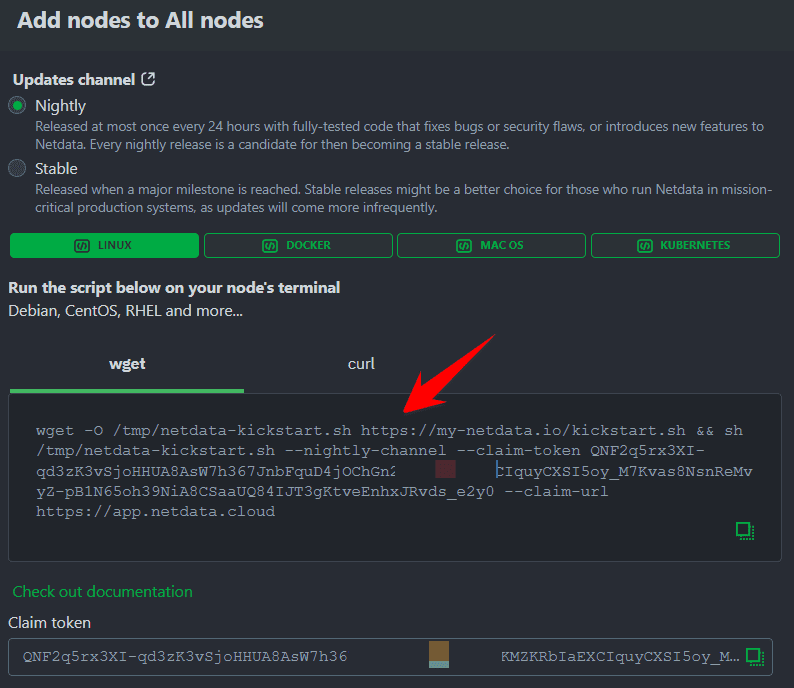
I will choose to use wget for quick, copy the command below and paste it in Terminal on your Server. Everything will happen automatically.
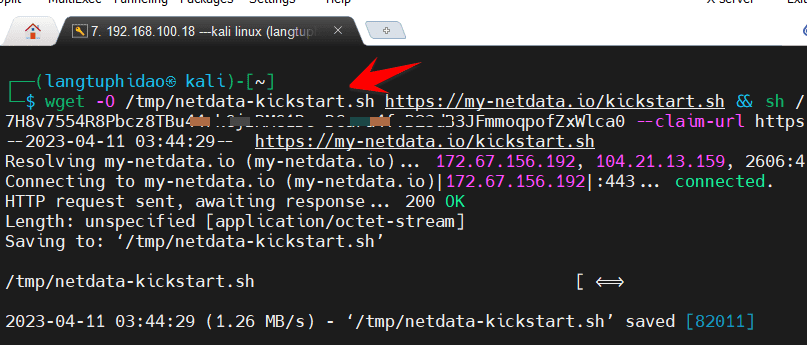
During the installation process, if a message appears, press y and Enter to continue.
After the installation is complete, go back to Netdata’s Web site, select All Nodes and select the table Nodestap the number first to see the performance of the Server you just installed.
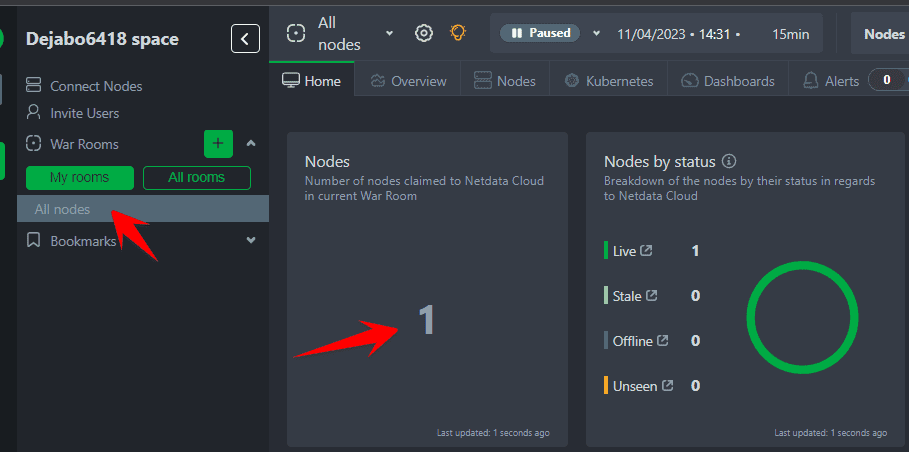
Wait about 1 minute for the Server to push CPU, RAM, Network data, hard drive read and write speed … to Netdata, you will see a very professional chart.

So you have installed Netdata to monitor the Server. Now we will configure Telegram to send notifications.
Create a Telegram Bot to report Server problems using Netdata
By default, Netdata will send an email notification when the Server has a problem, but if you want to notify via Telegram Bot, you can follow these steps:
Step 1: Enter https://t.me/BotFather type command /newbot to create a new Bot (see details on how to create a Telegram Bot here). Remember to copy the Bot’s Token after it is created.
Step 2: Chat with Bot https://t.me/myidbot type command /getid to see your Telegram ID. If you want bots to send notifications to the Group, add bots @myidbot Go to Group then type the command /getgroupid to get the Group ID.
Step 3: At the Server, access the path: /usr/lib/netdata/conf.d/. Open File health_alarm_notify.confedit the following lines again:
- Set SEND_TELEGRAM to YES.
- Change TELEGRAM_BOT_TOKEN to the Token Bot you got in Step 1
- Set DEFAULT_RECIPIENT_TELEGRAM to the Telegram ID you got in Step 2 (if Group ID will have a – in front)

Next, Restart Netdata with the command: service netdata restart
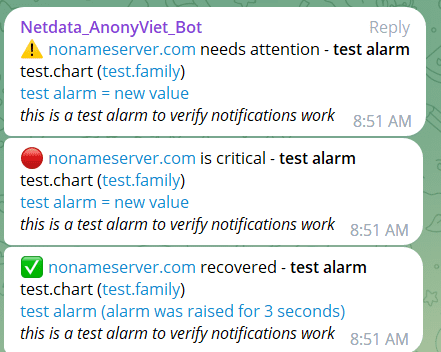
To test whether Netdata sends notifications about Telegram, use the command: bash -x /usr/libexec/netdata/plugins.d/alarm-notify.sh test
If you see the picture, the configuration is successful:
To change the Server’s HOSTNAME when recognized by Netdata, do the following:
Open file /etc/netdata/netdata.conf Add line: hostname = Tên-Server in the last line.
Next, Restart Netdata with the command: service netdata restart done.
You should combine with Kuma Uptime to increase the ability to monitor the system better.


