This article will show you how to make min exponential graph in Excel.
| Join the channel Telegram of the AnonyViet 👉 Link 👈 |
Exponential Graph Smoothing
This example shows you how to apply exponential graph smoothing to time series in Excel.
Exponential smoothing is used to smooth out outliers in a graph.
1. First, look at the time series below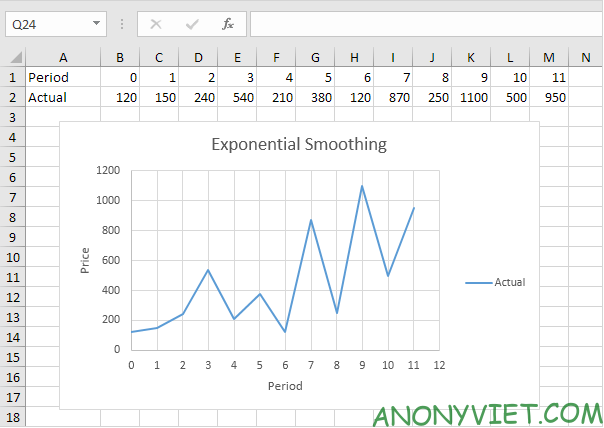
2. On the Data panel select Data Analysis.

3. Select Exponential Smoothing and click OK.
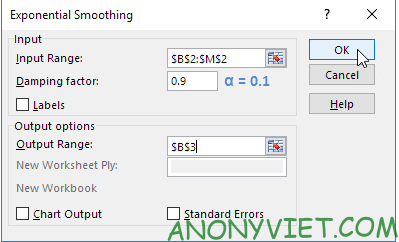
4. Click the Input Range box and select the range B2:M2.
5. Click Damping factor and enter 0.9.
6. Click the Output Range box and select cell B3.
7. Press OK
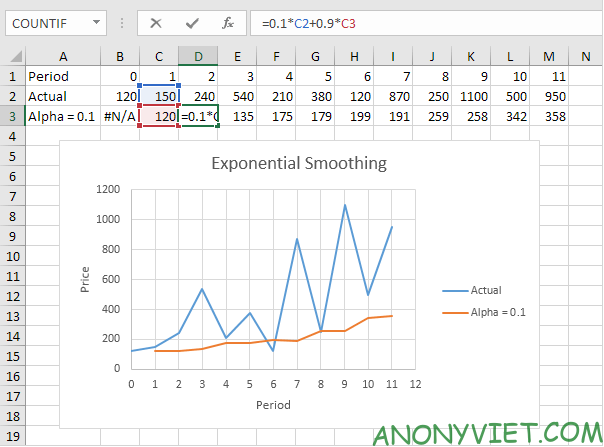
8. Plot a graph of these values.
9. Repeat steps 2 through 8 for alpha = 0.3 and alpha = 0.8.
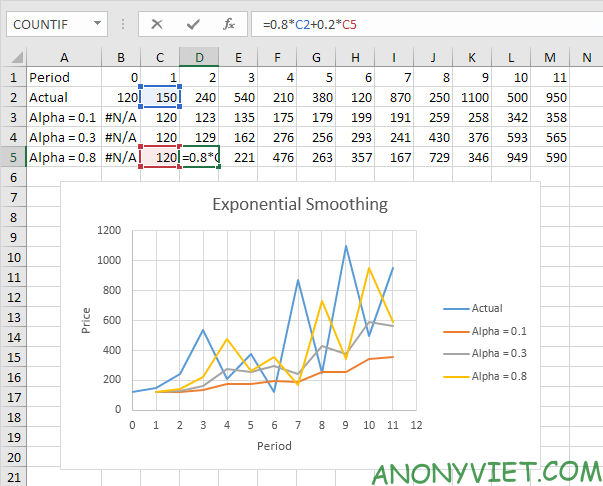
Conclusion: The smaller the alpha, the more smooth the tops and bottoms are. The larger the alpha, the smoothed values.
In addition, you can also view many other excel articles here.

