OllyDBG or Olly for short is a very popular debugging tool. Thanks to its intuitive and easy-to-use interface, Olly is suitable for users of all levels.
| Join the channel Telegram of the AnonyViet 👉 Link 👈 |

Some of Olly’s functions can be mentioned:
- Trace registers, find loops, switches, API calls,
- Download and debug the dll modules
- Allows to add your own commands and labels of functionality for annotation and visualization when you RE
- Attaack a running program
- Find constants and address ranges easily
- Allows setting breakpoints (breakpoints) for easy debugging and monitoring
- Set the Breakpoint hadware
- Search string
- See API functions being called
- Allow to create dump file of process
- Edit and fix the error by default
- Debug the program step by step (Step-by-Step)
- etc
Program overview
As soon as you run the program, you can see OllyDBG’s interface divided into 5 very intuitive windows.
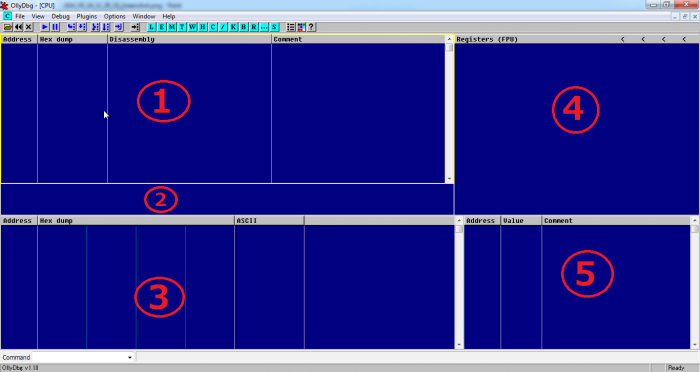
Door #1: CPU
This is the main and frequently used window of the program. This window consists of 4 columns:
- Column 1: Address: Displays the instruction address in the memory area
- Column 2: Hex dump: Displays the Opcode of the command
- Column 3:Disassembly: Show Assembly code
- Column 4: Comment: Displays the notes. We can also make our own notes in this column
Door #2: Located just below the first window
Display argument values of ASM . statements
Window 3: Address, Hex dump, ASCII or UNICODE
Observe the change of device values in the program
Use to find strings in memory
Consists of 3 columns:
- Column 1: Address: Displays the address of the device
- Column 2: Hex dump: Displays the memory value as Hex
- Column 3: ASCII or UNICODE: Display the device value as ASCII or UNICODE
Window 4: Registers [FPU, MMX, 3DNow!] :
Display the value of registers and flags in Assembly. This window is necessary for us to monitor the change in the value of registers, math instructions, etc.
Window 5: STACK
Display the value in the stack area
Bạn có thể sử dụng phím tab hay shift tab để chuyển đổi giữa các cửa sổ
Nếu các bạn không thấy được các bar trong mỗi cửa sổ thì các bạn có thể click chuột phải tại cửa số đó và chọn Appearance-> Show bar
Components in Olly Debug
Above the windows is the taskbar, used to execute the program’s functions.

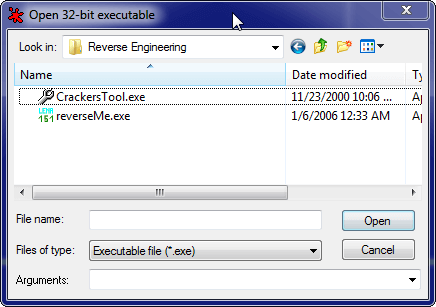
Open a program

To debug a program, we use File->Open or use the shortcut F3: Open the file to be Debug
OllyDBG supports debugging 2 file types, .exe and .dll.
Attachments: Allows Deassembly of an executing program.
With some software capable of Anti-Debug, when starting up will generate Anti-Debug code, but after running it can be or it will use a subroutine to run the main program. After the subroutine has finished executing, the subroutine will terminate itself and then the main program will continue to be executed. Then we can’t debug the main program anymore. So Attach function was created to help debug programs running in memory.

Restart debug (Ctrl + F2): Debug the program again.
Debug a program
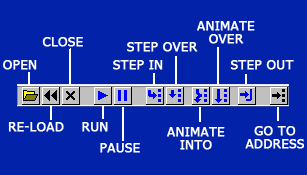
Here are some functions used in debugging a program
| Function | Description |
|---|---|
| Run (F9) | Run the program |
| Close (Alt-F2) | Close the file that is Dissassembler |
| Step into (F7) | Debug into functions |
| Step over (F8) | Debug outside of functions |
| Animate into (Ctrl-F7) | Automatically run with “Step into” mode until the next breakpoint is met or until the user presses pause (F12) |
| Animate over (Ctrl-F8) | Automatically run with “Step over” mode until the next breakpoint is met or until the user presses pause (F12) |
| Execute to return ( Ctrl-F9) | Execute until the function returns |
| Execute to user code (Alt-F9) | Execute until the user’s code is encountered |
Trace Tool
- Trace into (Ctrl – F11) and Trace over (Ctrl – F12): These are 2 similar functions Animate Into / Animate over. That is, the computer will automatically Step Into / Step Over for us. However, for Trace Into / Trace Over, we can set a stop condition. That is, when a certain condition previously set is satisfied, the program will automatically stop at the statement that satisfies the condition we set.
- Set Condition: Set the condition
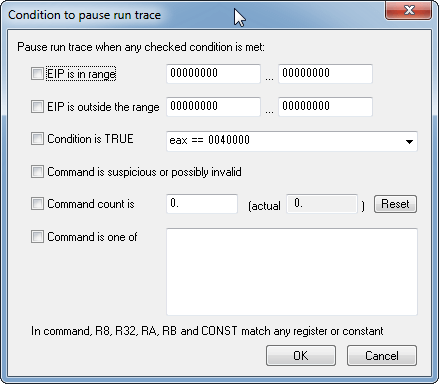
You can set the condition of EIP or of any register, to a certain value or range etc. For example in the image above, I am setting the condition to stop until the eax register ==0040000. In addition, Olly also supports a number of other programs needed for debugging programs such as:
| Function | Description |
|---|---|
| Log (Alt + L) | Show logged log (modules loaded, unloaded etc.) |
| Executable modules (Alt + E) | Executable modules of the program |
| Memory (Alt + M) | Displays all memory blocks allocated by the program. |
| Threads | Show all threads of the program |
| CPU (Alt + C) | Main working window screen |
| Patches (Ctrl + P) | Show all the ‘patches’ that you have created, when there are any code changes between the old code and the new code’ |
| Call stack (Alt + K) | Show more details of the stack in another window, including values sent from functions |
| Breakpoints (Alt + B) | Displays all breakpoints currently being set |

