This article will show you how to create a heat map in Excel.
| Join the channel Telegram of the AnonyViet 👉 Link 👈 |
Create heatmaps in Excel
1. Select range B3:M11
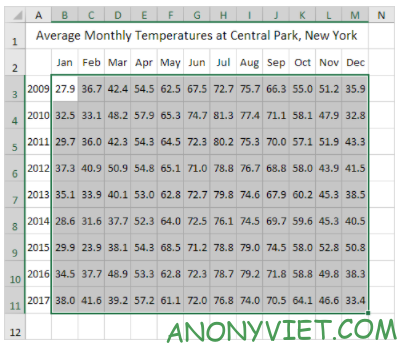
2. In the Home panel, Select Conditional Formatting

3. Select Color Scales -> subtype
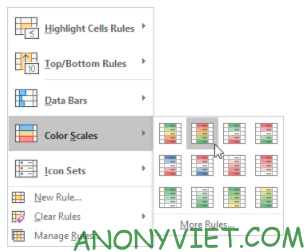
Heatmap result generated with numbers
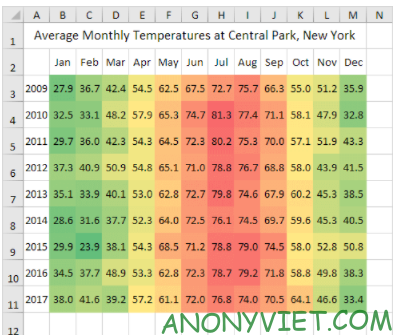
4. select range B3:M11.
5. Right-click and choose Format Cells
6. Select Custom category
7. Enter type: ;;;
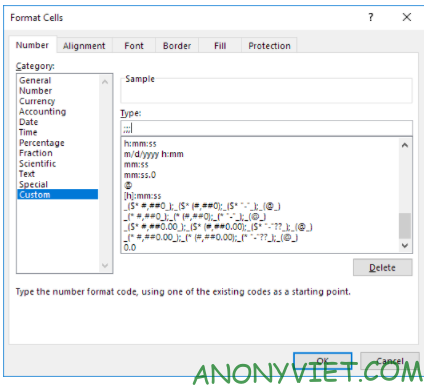
8. Press OK
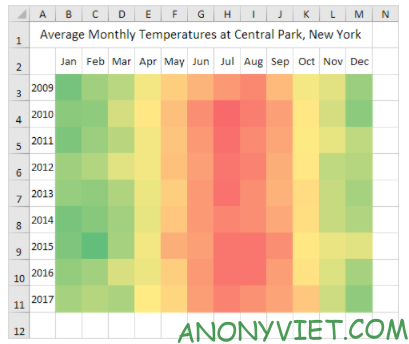
The resulting heatmap has been generated,
In addition, you can also view many other excel articles here.


